Home / Datasets / Freight demand regions Freight demand regions Put freight-demand reports on a consistent geographical foundation. Region polygons connect domestic freight reporting areas with their statistical boundaries.
Sign up 200+ freight reporting regions · observed 2026-09-23
Coverage 200+ domestic regions matched to 2022 statistical boundaries by exact normalized name and state. Metropolitan regions can have separate state portions; these are statistical reporting areas. See what's inside Part of Transport & Logistics
Time structure Reference snapshot
History available Published inventory or reporting period; see coverage for the source dates.
Observation frequency Varies by underlying publication.
Reporting lag A refresh does not change the date of the underlying observation.
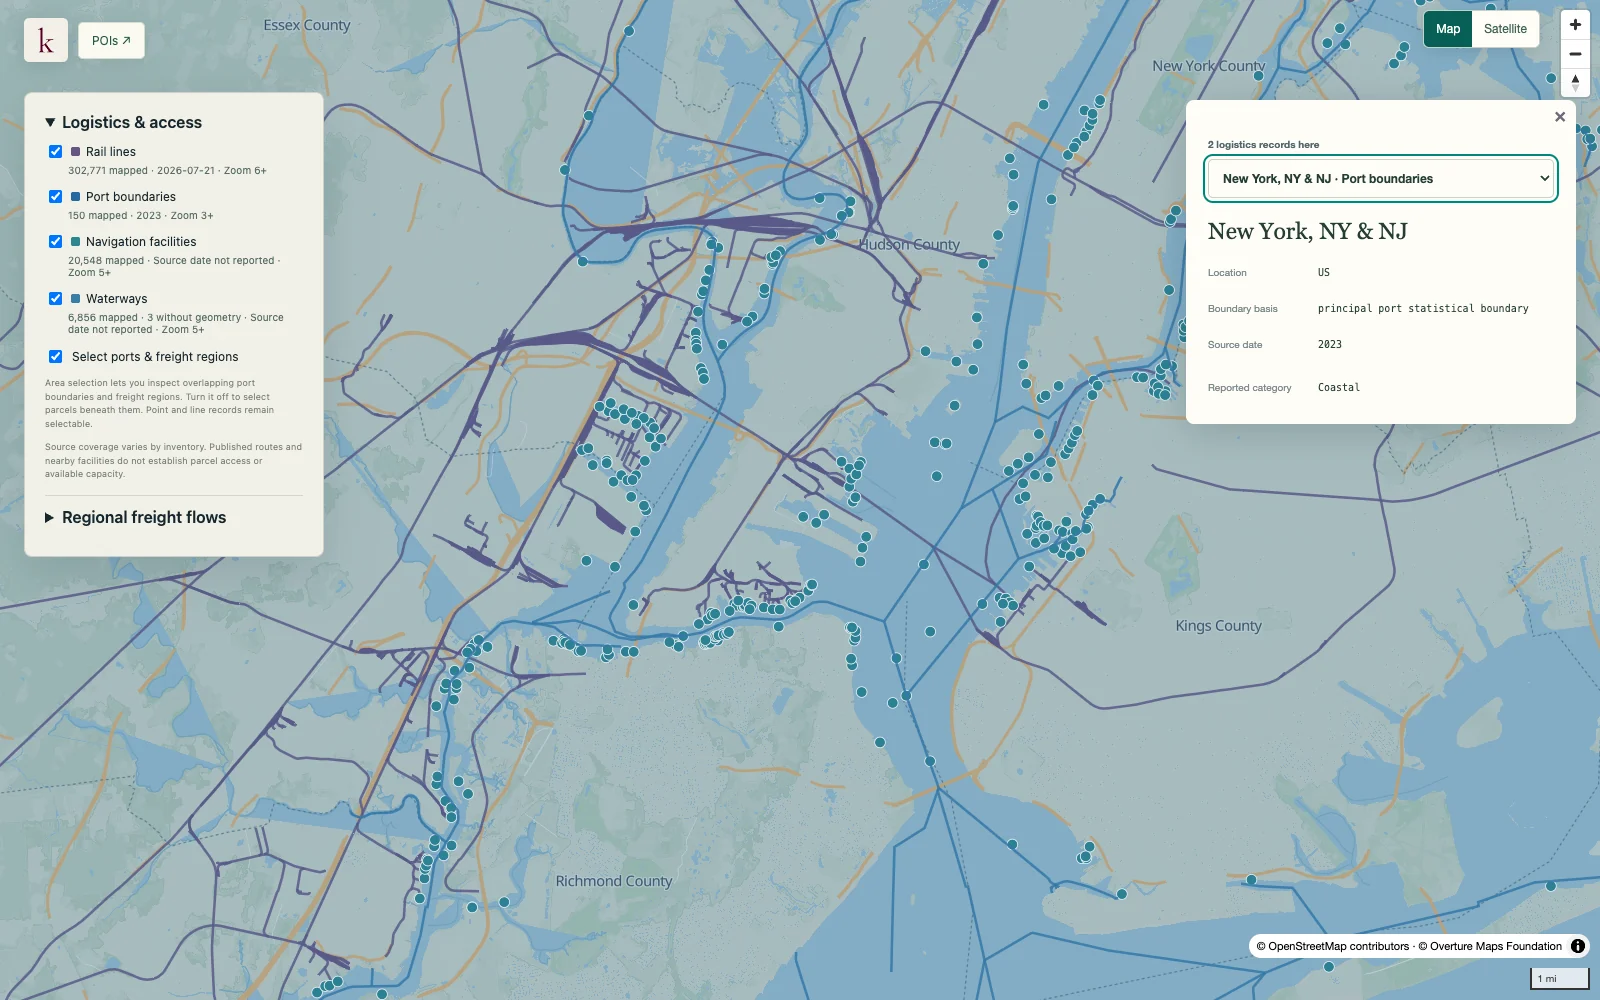
Inventory checked 2026-09-23. Coverage dates describe this checked inventory. New York / New Jersey harbor · Port, rail and waterway context. What's in this dataset
Region code and name Domestic identity and descriptive name.
Source boundary Published region polygon rather than a point approximation.
State context State and metropolitan-area portions remain distinguishable.
Freight linkage Region codes connect the geography to commodity-flow observations. Questions worth exploring Choose the appropriate region for comparing freight demand. Place a candidate logistics site within the geography of available flow statistics. Tell us about your project
About this data Is a freight region a terminal service area?+ No. It is a statistical geography used to report freight estimates, not a facility catchment, delivery commitment or development restriction.
Why can a metropolitan area appear in more than one region?+ The reporting system can separate state portions of a multi-state metro area. Keeping the codes distinct preserves the flow table's geography.